
The average Stafford home sold for £259,721 in June, a second monthly fall that leaves it £6,347 below April's record high. The year is still up 4.4%.
The average Stafford borough home sold for £259,721 in June 2026, according to figures published at 9.30 this morning by HM Land Registry. That is the second monthly fall in a row, and it leaves the borough £6,347 below the record high of £266,068 it set in April. (UK House Price Index, Stafford, June 2026)
Look at the year rather than the month and the picture reverses. Prices here are up 4.4% on June 2025, worth £11,014 on the average home. England rose 1.8% over the same twelve months and the West Midlands rose 2.6%, so Stafford is running at well over twice the national rate.
Fifth of nine in Staffordshire, and every one beat England
The index covers every council area in the county on the same day and the same basis, which makes the comparison a fair one. All nine rose over the year, and all nine beat England.
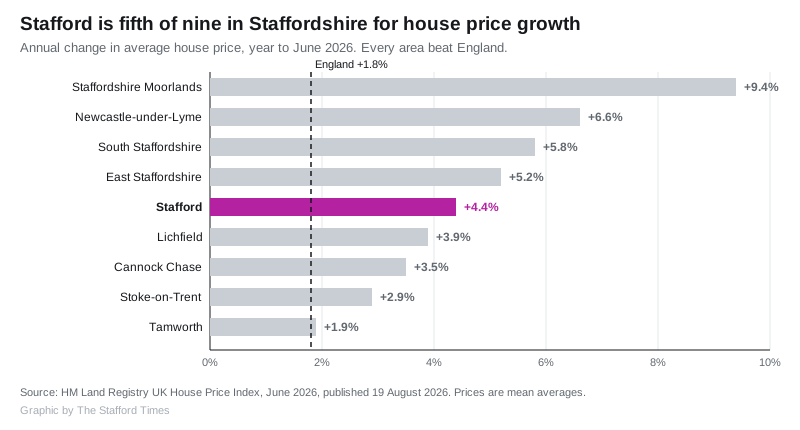
Stafford’s 4.4% puts it fifth of the nine, behind Staffordshire Moorlands on 9.4%, Newcastle-under-Lyme on 6.6%, South Staffordshire on 5.8% and East Staffordshire on 5.2%. It is ahead of Lichfield, Cannock Chase, Stoke-on-Trent and Tamworth, where prices rose just 1.9%.
On price rather than growth, the borough sits in the middle of the county too. Stafford’s £259,721 is above the Staffordshire county average of £250,586 and well above Stoke-on-Trent at £148,799, but below South Staffordshire at £310,258 and Lichfield at £337,052.
Set against the whole of England, Stafford is still the cheaper option. A typical English home now costs £293,262, so a Stafford one is about £33,500 less. Across all 295 English local authority districts, the borough ranked 97th for annual change and 111th cheapest.
Semis and terraces are pulling the average up
The index splits the borough by property type, and the year-on-year gains are not evenly spread.
| Type | Average price | Annual change | Change in cash |
|---|---|---|---|
| Detached | £397,717 | +3.7% | +£14,332 |
| Semi-detached | £251,405 | +5.3% | +£12,736 |
| Terraced | £195,351 | +5.4% | +£10,009 |
| Flat or maisonette | £111,677 | +1.5% | +£1,681 |
| First-time buyer | £210,700 | +4.8% | +£9,591 |
Terraces and semis, the shape of most of Stafford, Stone and the estates around them, rose fastest. Flats went almost nowhere.
That gap is not new. The index sets January 2023 at 100 for every area and every type. Stafford flats now read 101.7, against 109.9 for semis, 109.3 for terraces and 108.0 for detached homes. In three and a half years the borough’s flats have gained 1.7% while its semis have gained almost a tenth.
Two falls do not make a slump, but they are worth noting
The monthly run since the turn of the year reads: down 1.0% in January, up 1.6% in February, up 0.5% in March, up 2.1% in April, down 1.6% in May, down 0.8% in June. April’s £266,068 was the highest monthly average the borough has recorded.
Two things should temper any reading of that. The first is volume. Stafford records a small number of completions each month, and the last month with a published count is April 2026, at 125 sales. March was 150 and February 121. On numbers that size a handful of large sales move the average.
The second is that the index revises. Our own record of the May figure, taken from the July release, read £263,494 and an annual rise of 4.7%. This morning’s release restates the same month as £261,897 and a rise of 4.1%, a downward revision of £1,597 to a figure that had already been published. Treat this month’s number as provisional too.
What it means for you
If you are buying. The discount is in flats. The borough average is £111,677, up just 1.5% in a year, against £195,351 for a terrace. The first-time buyer average is £210,700, £49,021 below the all-types figure.
If you are selling. The market you are selling into is not April’s. The average is £6,347 below the peak set four months ago, and the last two months have both gone backwards. An April valuation is likely to be ahead of the market.
If you are remortgaging. The longer trend is still firmly your friend. The borough index stands at 108.4 against January 2023, so the average home is 8.4% above where it was three and a half years ago, £239,645 then against £259,721 now.
One warning about the number itself. UK HPI is a mean average, not a median, so it is pulled about by the top of the market in a way a median is not. It is built from completed Land Registry sales rather than asking prices, which makes it slower but harder to argue with.
The next release, covering July 2026, is due at 9.30am on 16 September 2026.
For the longer view, including median sold prices for Stafford, Stone, Eccleshall and Gnosall built from individual Land Registry sales, see our Stafford house prices page. Our Stafford planning news page covers the supply side of the same question, including the borough’s five-year housing land supply.
Sources
- UK House Price Index, Stafford, June 2026, HM Land Registry, published 19 August 2026, for the average price, the annual and monthly changes, the property type splits, the index against January 2023 and the sales volumes.
- UK House Price Index for June 2026, HM Land Registry, for the England and regional figures and the release date.
- ONS local housing prices for Stafford for the same series presented for the borough.
- UK House Price Index, Staffordshire for the county and neighbouring district figures used in the chart.
Have your say